Introducing the New Analytics Dashboard

Fully customisable, interactive control & multiple views.
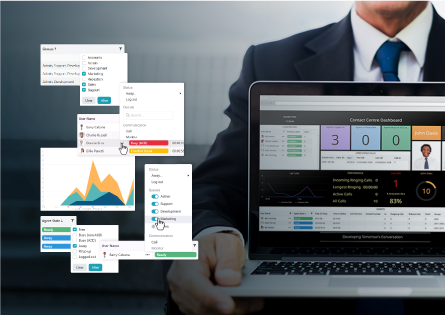
We are excited to introduce our new ‘Dimensions Dashboard’, which is a fully customisable interface that provides easy access to the tools you need to monitor your business communications. Our new dashboard is equipped with grids, charts, and multi-stat tiles to make it easy for businesses to track their staff performance and customer experience.
Analytics Dashboard
Our ‘Analytics Dashboard’ is another tool we’ve introduced that provides businesses with the data they need to manage their communications efficiently. This tool offers live information on queuing calls and agent states, allowing service levels to be actively managed. Additionally, we now support additional away state information, providing clear information on what each user is doing in real-time and for historical analysis.
We understand that managing a team, whether in the office or remote, can be challenging. That’s why we’ve made it easy to keep track of what everyone is doing with our new user grid. Up-to-date presence is shown along with details of each user’s activity for the day, simplifying user management.
Contact Centre Dashboard
Our Contact Centre Dashboard is the essential tool for getting the most out of your agents and maximising customer service levels. It provides live information on queuing calls and agent states, so that service levels can be actively managed. Whether monitoring queues individually or the business as a whole, Dimensions can not only alert supervisors to pending service level breaches, but also provides the tools to manage agent states, ensuring the best possible service is achieved.
We are thrilled to offer these new tools to our customers and are confident that they will make a significant difference in managing your business communications. The Dimensions Dashboard is available now on request, and it will be released to all customers in May.
To download a copy of our newsletter click below:
Download Newsletter